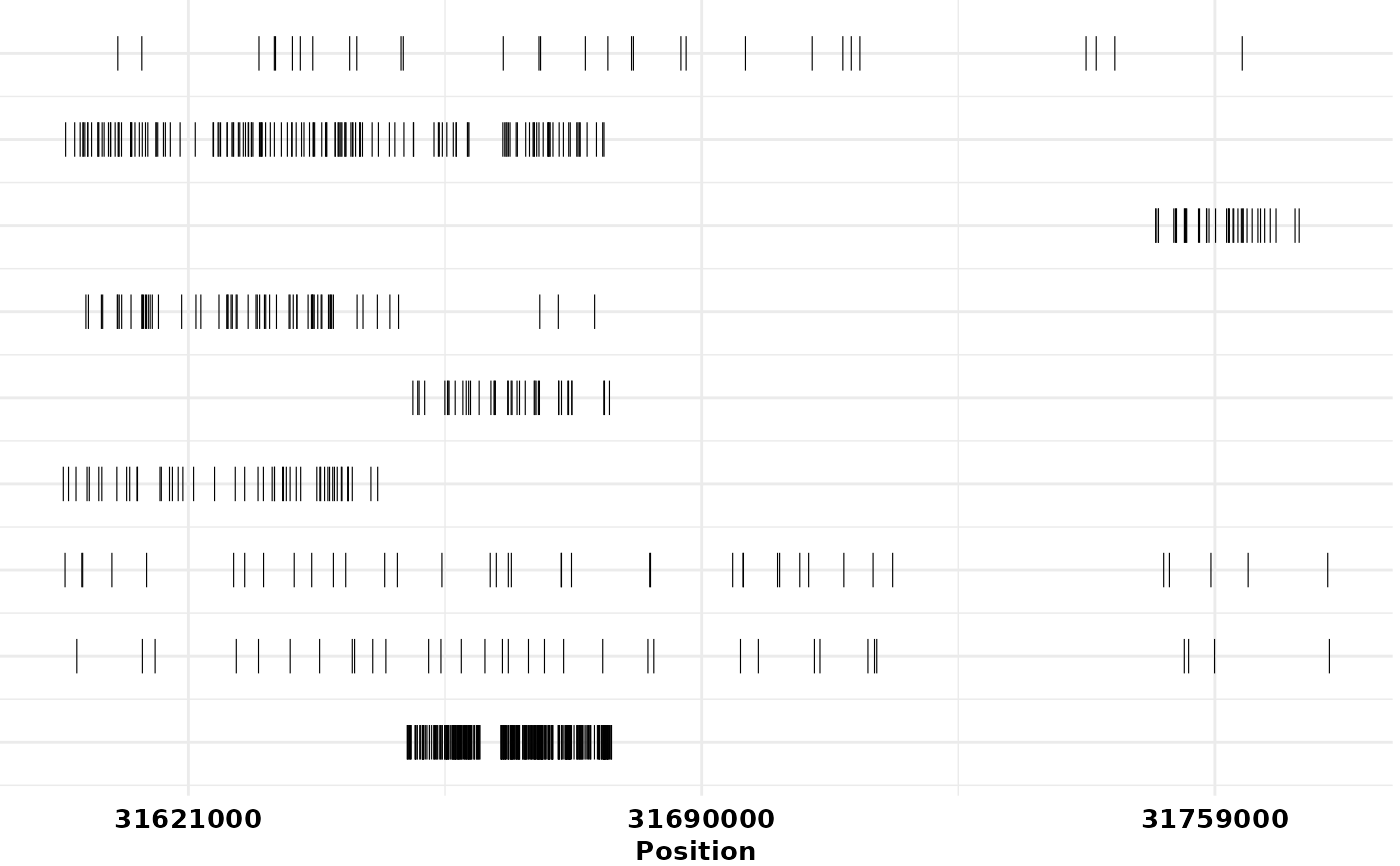
build_left_alleleplot() builds a horizontal plot displaying the chromosomal
position of each SNP locus, grouped by marker group. Makes use of the $Varfile
file from haplotype object. It is an internal function called by
crosshap_viz(), though can be called separately to build a stand-alone plot.
Usage
build_left_posplot(HapObject, epsilon, hide_labels = TRUE)
Arguments
- HapObject
Haplotype object created by run_haplotyping().
- epsilon
Epsilon matching the haplotype object used for umap_in.
- hide_labels
If TRUE, legend is hidden.
Examples
build_left_posplot(HapObject, epsilon = 0.6, hide_labels = FALSE)