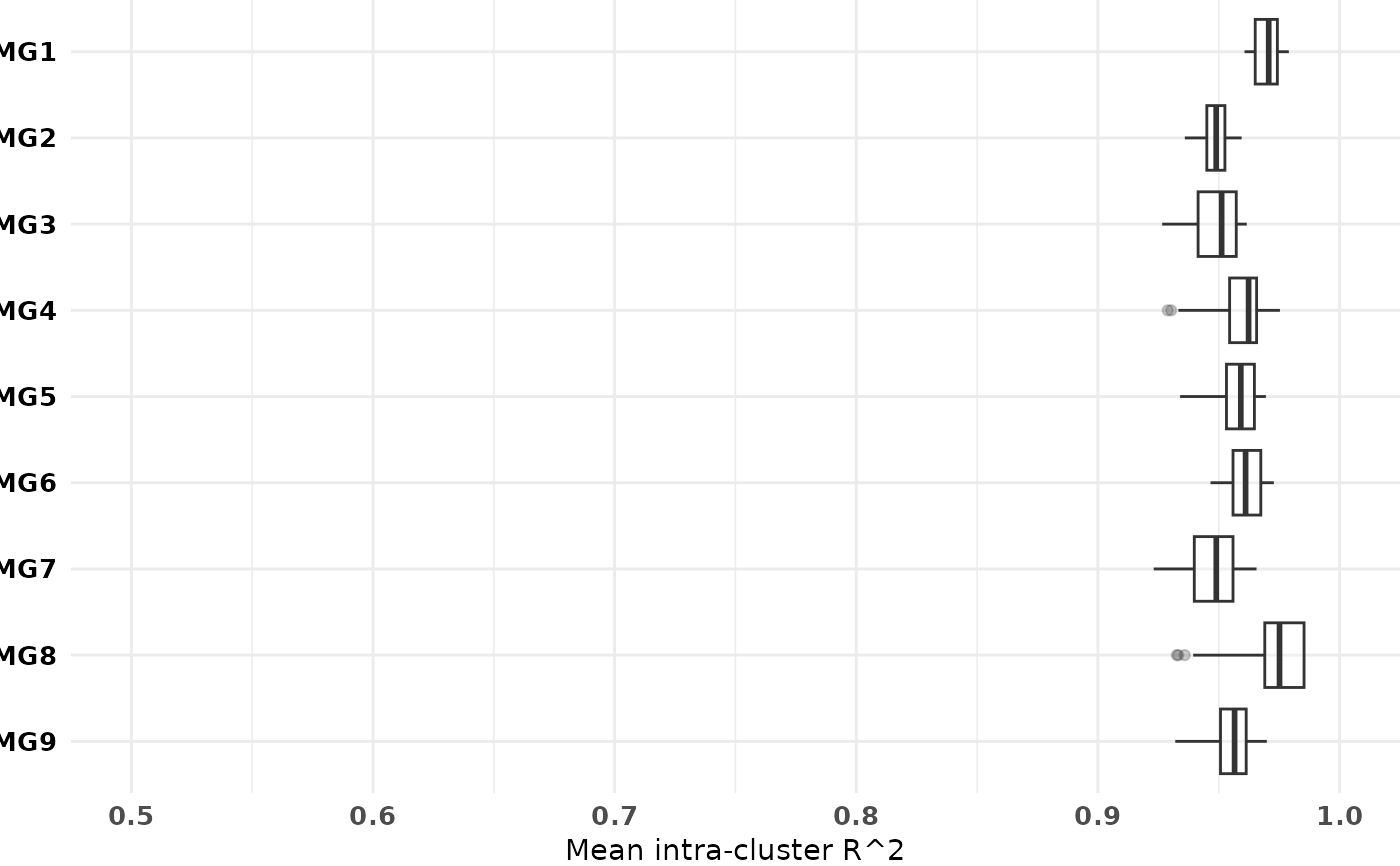
build_right_jitterplot() builds a horizontal plot displaying the mean pairwise R^2 linkage between each SNP and all other SNPs in its marker group, grouped by marker group, coloured by alternate allele frequency. Makes use of the $Varfile information from haplotyping object. It is an internal function called by crosshap_viz(), though can be called separately to build a stand-alone plot.