Skip to contents

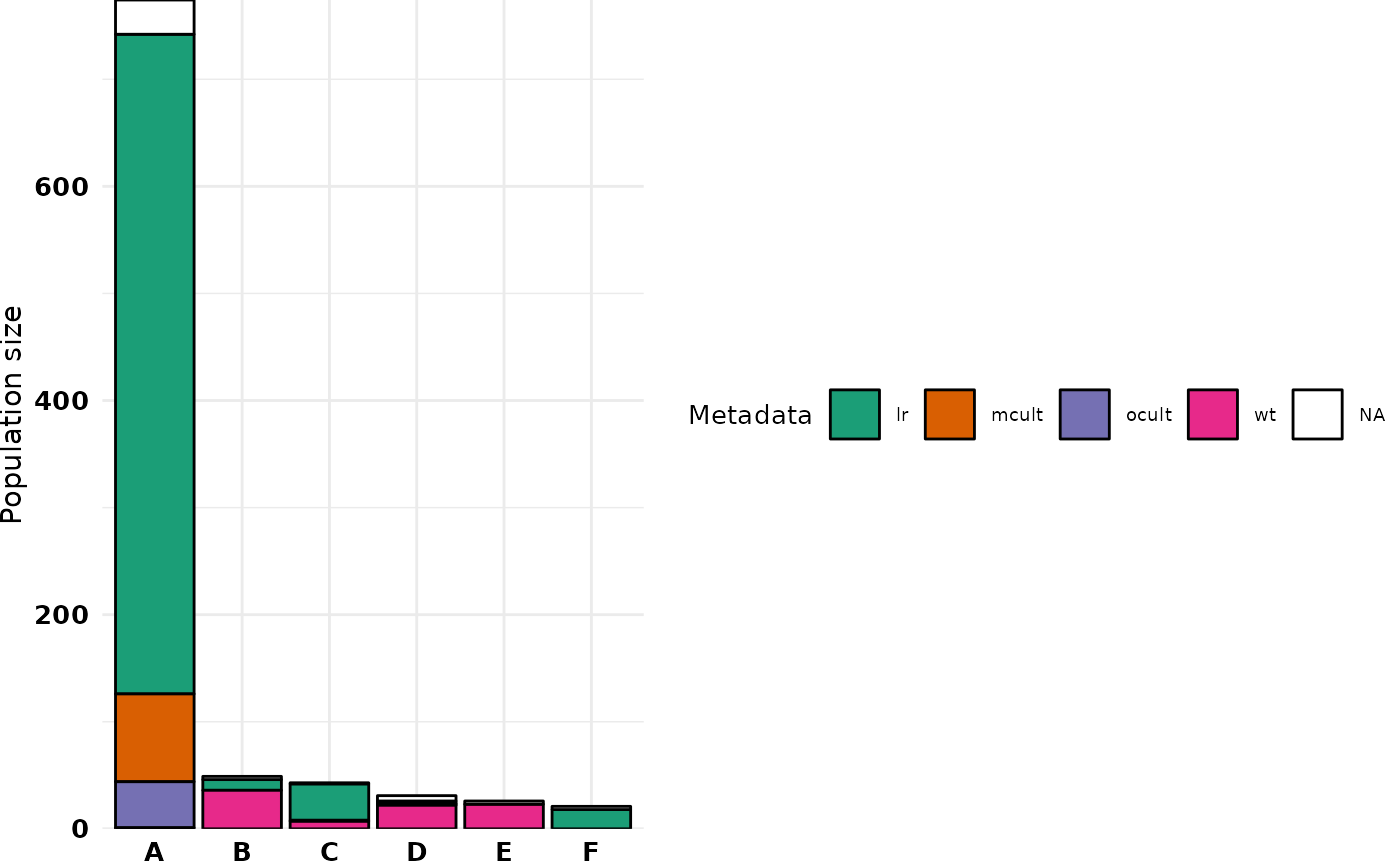
build_top_metaplot() builds a vertical stacked bar plot displaying the frequency of each haplotype combination, broken down by each categorical metadata variable provided. Makes use of the $Indfile information from a haplotype object. This is an in internal function called by crosshap_viz(), though can be called separately to build a stand-alone plot
Usage

build_top_metaplot(HapObject, epsilon, hide_labels = FALSE)

Arguments

HapObject

Haplotype object created by run_haplotyping()

epsilon

Epsilon to visualize haplotyping results for.

hide_labels

If TRUE, legend is hidden.

Value

A ggplot2 object.

Examples

build_top_metaplot(HapObject, epsilon = 0.6, hide_labels = FALSE)