
What does it do?
crosshap is an LD-based local haplotype analysis and visualization tool.
Given a genomic variant data for a region of interest, crosshap performs LD-based local haplotyping. Tightly linked variants are clustered into Marker Groups (MGs), and individuals are grouped into local haplotypes by shared allelic combinations of MGs. Following this, crosshap provides a range of visualization options to examine relevant characteristics of the linked Marker Groups and local haplotypes.
Why would I use it?
crosshap was originally designed to explore local haplotype patterns that may underlie phenotypic variability in quantitative trait locus (QTL) regions. It is ideally suited to complement and follow-up GWAS results (takes same inputs). crosshap equips users with the tools to explain why a region reported a GWAS hit, what variants are causal candidates, what populations are they present/absent in, and what the features are of those populations.
Alternatively, crosshap can simply be a tool to identify patterns of linkage among local variants, and to classify individuals based on shared haplotypes.
Note: crosshap is designed for in-depth, user-driven analysis of inheritance patterns in specific regions of interest, not genome-wide scans.
Installation
crosshap is available on CRAN:
install.packages("crosshap")For the latest features, you can install the development version of crosshap from GitHub with:
# install.packages("devtools")
devtools::install_github("JacobIMarsh/crosshap")
Usage
In short, a typical crosshap analysis workflow involves the following steps. For a detailed explanation and walk through, see our Getting started vignette.
- Read in raw inputs
read_vcf(region.vcf)
read_LD(plink.ld)
read_metadata(metadata.txt)
read_pheno(pheno.txt)- Run local haplotyping at a range of epsilon values
HapObject <- run_haplotyping(vcf, LD, metadata, pheno, epsilon, MGmin)- Build clustering tree to optimize epsilon value
clustree_viz(HapObject)- Visualize local haplotypes and Marker Groups
crosshap_viz(HapObject, epsilon)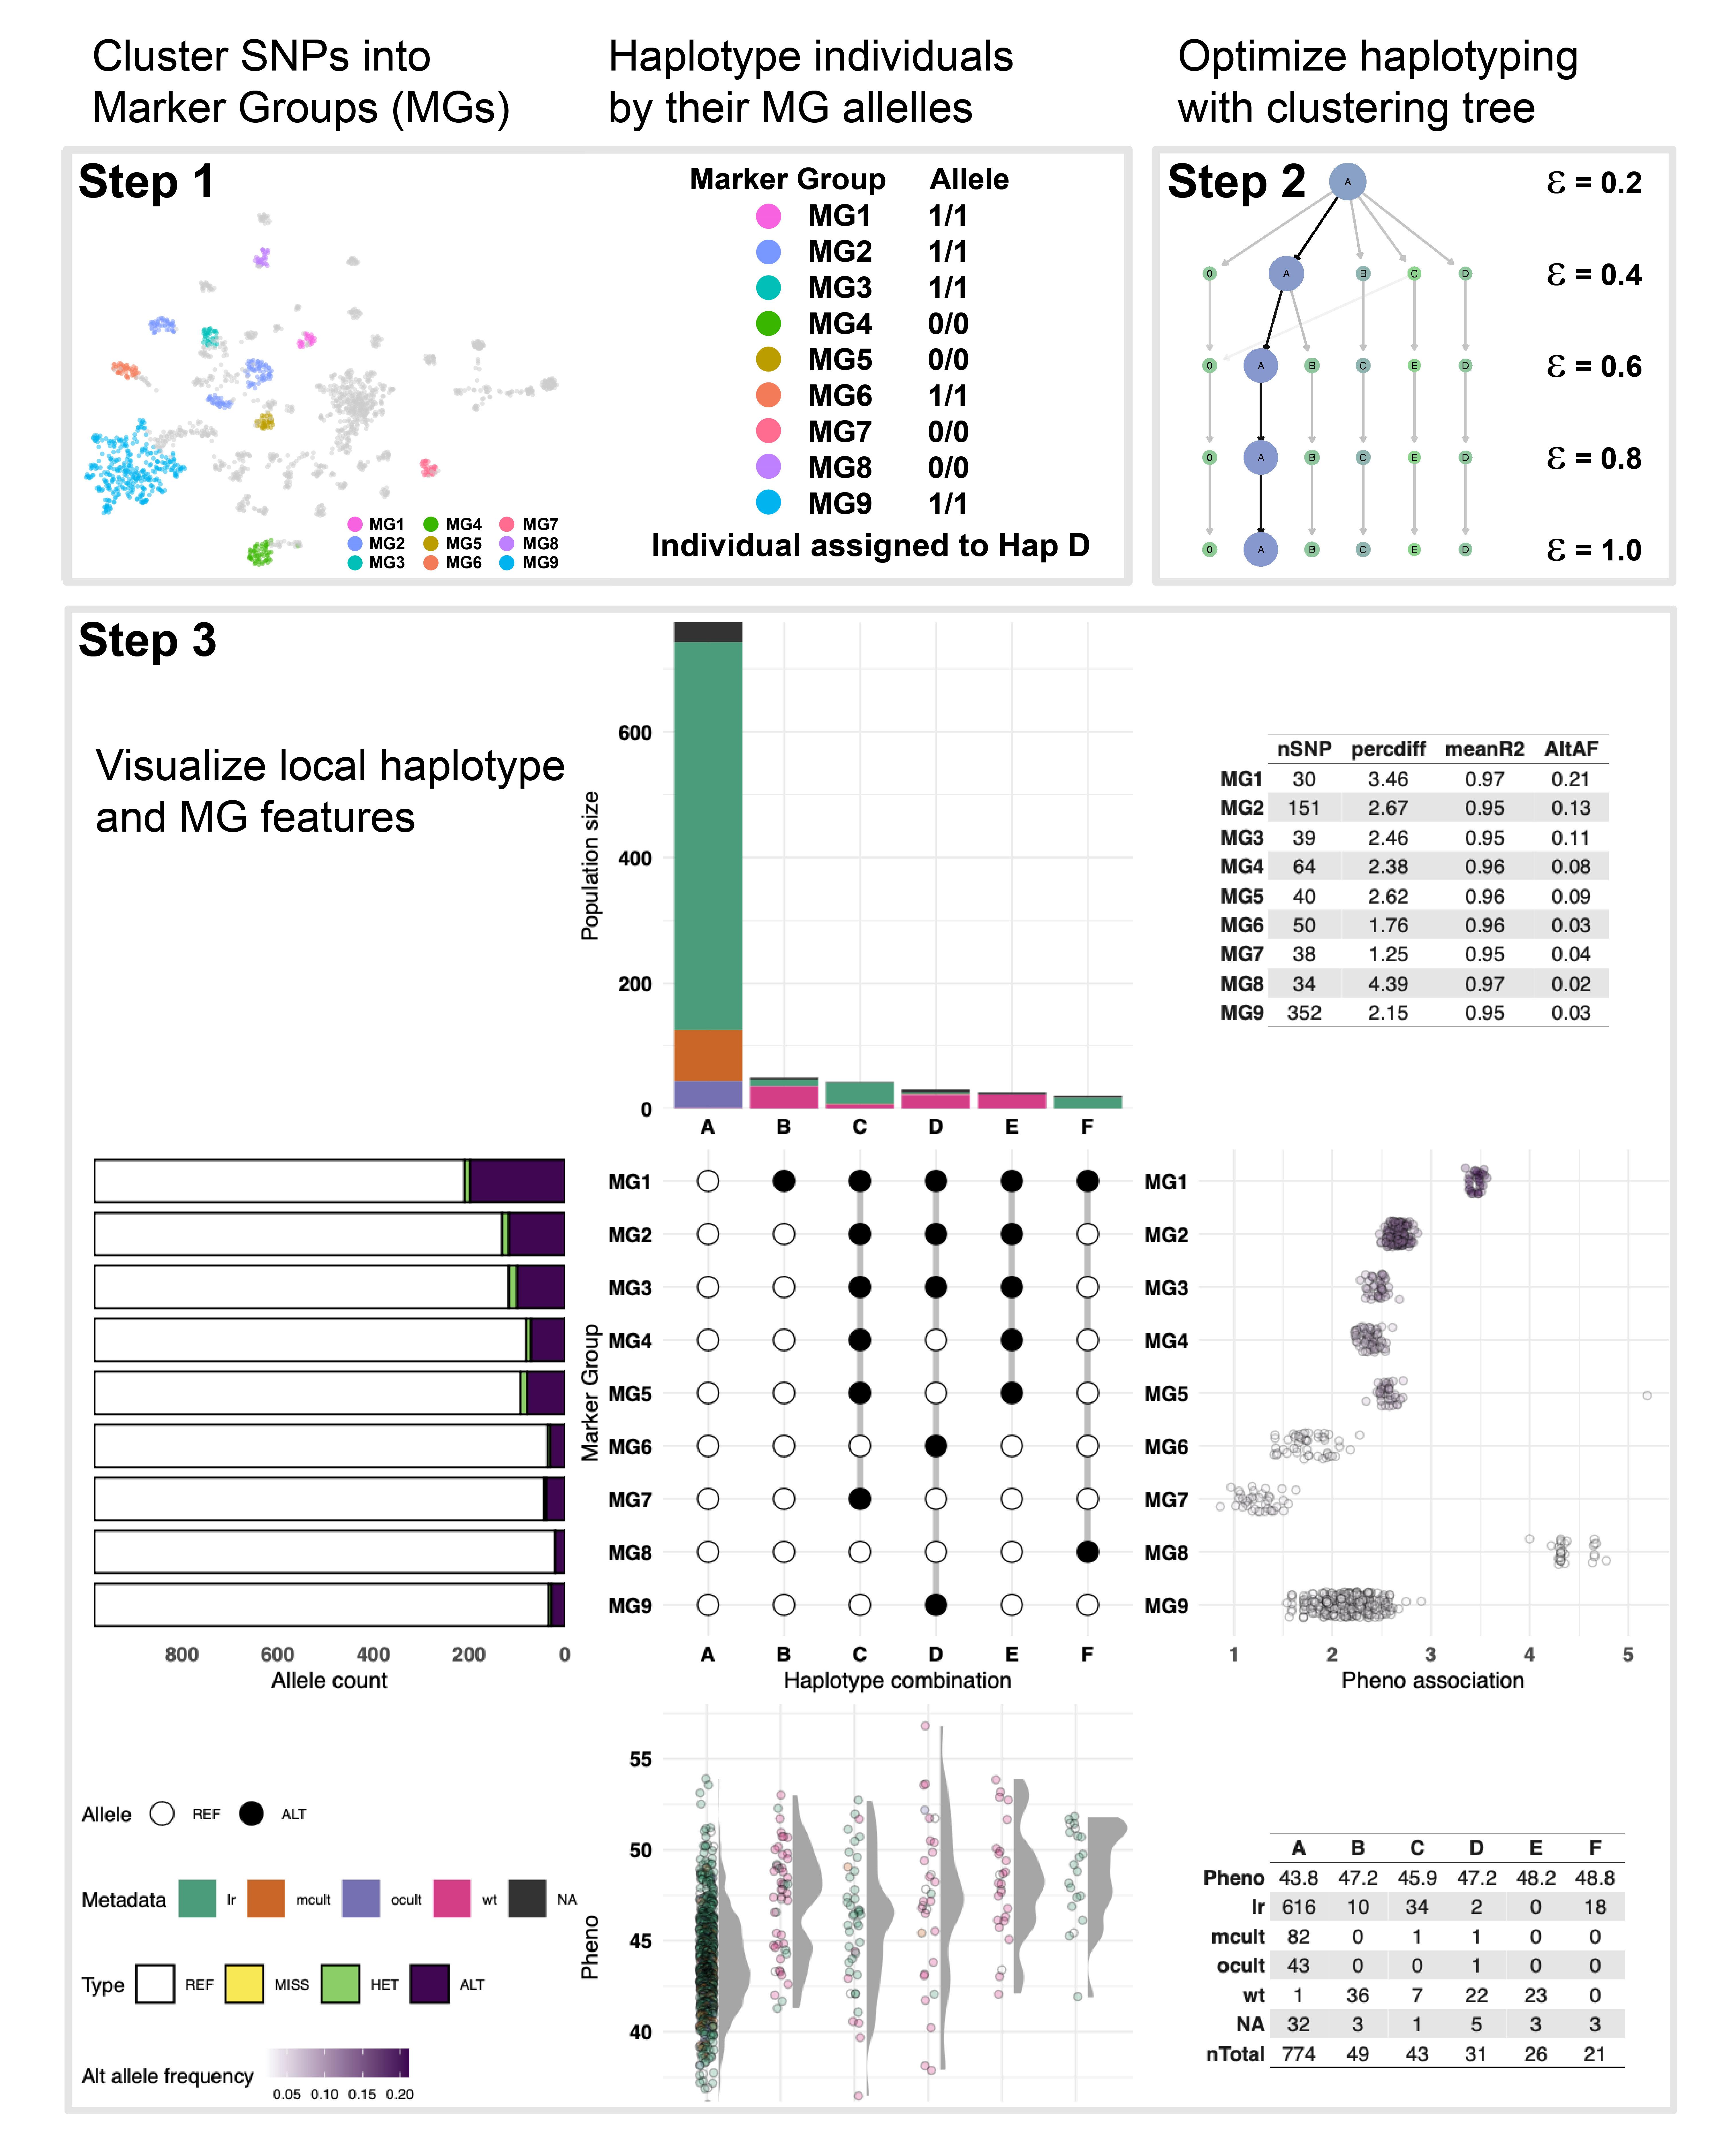
From here you can examine haplotype and Marker Group features from the visualization, and export relevant information from the haplotype object.
HapObject$Haplotypes_MGmin30_E0.6$Indfile
HapObject$Haplotypes_MGmin30_E0.6$Hapfile
HapObject$Haplotypes_MGmin30_E0.6$Varfile
Contact
For technical queries feel free to contact me: jacob.marsh@unc.edu . Please contact Prof. David Edwards for all other queries: dave.edwards@uwa.edu.au .